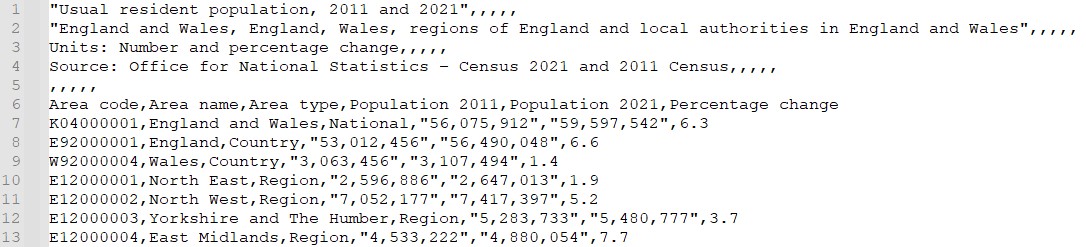
import pandas as pd# Read CSV file, skipping first 5 rows, using row 6 as header, and handling comma as thousands separatordf_pop = pd.read_csv('L1_data/UK_census_population.csv', skiprows=5, # Skip first 5 rows. Wnhy? thousands=',', # Interpret commas as thousands separators header=0# After skipping, the first row becomes the header)print(df_pop.head())
To add and run Python code
import pandas as pd# Read CSV file, skipping first 5 rows, using row 6 as header, and handling comma as thousands separatordf_pop = pd.read_csv('L1_data/UK_census_population.csv', skiprows=5, # Skip first 5 rows. Wnhy? thousands=',', # Interpret commas as thousands separators header=0# After skipping, the first row becomes the header)print(df_pop.head())
   Area code          Area name Area type  Population 2011  Population 2021  \
0  K04000001  England and Wales  National       56075912.0       59597542.0
1  E92000001            England   Country       53012456.0       56490048.0
2  W92000004              Wales   Country        3063456.0        3107494.0
3  E12000001         North East    Region        2596886.0        2647013.0
4  E12000002         North West    Region        7052177.0        7417397.0

   Percentage change
0                6.3
1                6.6
2                1.4
3                1.9
4                5.2
To add a photo - replace the path. Using relative path is also okay.
To add some “questions”
The qmd file will be rendered as two files in sessions folder, including a html and ipynb format. The html file will contain both question and answer, while the ipynb file will contain only the question.
if'Moscow'in ['Moscow', 'Beijing']:print("Moscow is in the cities list.")else:print("Moscow is not in the cities list.")
Moscow is in the cities list.
You’re Done!
Congratulations on completing the first QM practical session! If you are still working on it, take you time.
Don’t worry about understanding every detail of the Python code — what matters most is knowing which functions to use for a specific task, like checking minimum and maximum values or generating boxplots, and knowing how to debug when it goes wrong. Remember, practice makes perfect.