Exploratory Data Analysis #1
Understanding and describing data
Huanfa Chen - huanfa.chen@ucl.ac.uk
12 September 2025
This week
Understanding and describing data
Quantitative research is the process of collecting and analysing numerical data to describe, model, and predict variables of interest.
Garbage in, garbage out.
Learning Objectives
By the end of this lecture you should:
- Understand basic data types;
- Consider how to summarise and represent data.
Data types
Four levels of measurements
| Nominal | Ordinal | Interval | Ratio | |
|---|---|---|---|---|
| Categorizes and labels variables | ✔ | ✔ | ✔ | ✔ |
| Ranks categories in order | ✔ | ✔ | ✔ | |
| Has known, equal intervals | ✔ | ✔ | ||
| Has a true or meaningful zero | ✔ |
- Developed by psychologist Stanley Smith Stevens (1906 - 1973)
Nominal
- Differentiates items based only on names; no order between them.
- Also called categorical data
- Example: colour, gender, country names
- What can be said about them?
- Equality: ‘apple’ is not ‘pear’, ‘apple’ is ‘apple’
- Mode: the most common item
Ordinal
- Allow for rank order, but not the relative degree of difference
- Example: measurement of opinions
- completely agree
- mostly agree
- neither degree nor disagree
- mostly disagree
- completely disagree
- What can be said about them?
- ✅ Equality; mode
- ✅ Median: middle-ranked item
- ❌ Differences between two levels; arithmetic mean
Interval
- Allow for degree of difference between items, but not the ratio
- The zero value is arbitrary
- Example: Celsius temperature
- Definition: define 0°C & 100°C, and then separate them into 100 intervals.
- Depends on altitude/elevation
- What can be said about them?
- ✅ equality, mode, median
- ✅ addition, arithmetic mean
- ❌ ratio (100°C is NOT twice 50°C)
Interval
- Another example: longtitude & latitude coordinates
- The coordinate of 8 is twice as far as that of 4? ❌
Ratio
- Allow for ratio between items
- The zero value is unique and non-arbitrary.
- Example: mass, length, energy
- What can be said about them?
- ✅ Equality, mode, median, arithmetic mean
- ✅ Ratio (2kg is twice as heavy as 1kg)
Notes
- ‘Encoding’ does not change the nature of a measurement.
- Gender variable (male, female, others) is NOMINAL.
- If this variable is encodeded {male:0, female:1, others:2}, is it NOMINAL, or INTERVAL?
Another categorisation: numerical vs. categorical
| Type | Category | Notes |
|---|---|---|
| Quantitative (numerical) data | Discrete data | Only in whole numbers, e.g. number of staffs |
| Continuous data | e.g. temperature, 23°C, 23.4°C | |
| Qualitative (categorical) data | Nominal | Same as nominal in ‘Levels of measurement’ |
| Ordinal | See above |
Quiz time
How do you descibe a ratio data?
Key metrics
- Quantity
- The middle
- The spread
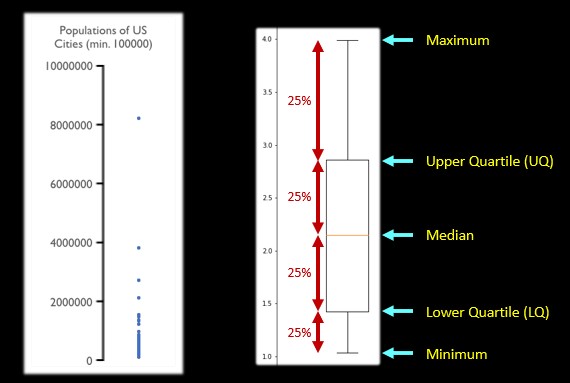
US city population
- Quantity: 282 values
- The middle: Mean 302869.3
- The middle: Median 167744.5 (Very different from mean)
- The middle: Mode 106433 (Useful? ❌)
- Should use mean or median? median is better than mean, as data is unlikely normal distributed
Variance: quantifying spread
Denote city population by \([y_1, y_2, ..., y_n]\) and variance by \(\sigma^2\)
\[ \begin{aligned} \sigma^2 &= \frac{\sum_{i=1}^{n} (y_i - \bar{y})^2}{n} \\ &= \frac{(y_1 - \bar{y})^2 + (y_2 - \bar{y})^2 + \dots + (y_n - \bar{y})^2}{n} \end{aligned} \]
A large variance means considerable spreadedness in data.
Standard deviation \(\sigma\)
\[ \begin{aligned} \text{Standard Deviation} = \sqrt{\text{Variance}} \end{aligned} \]
- Unit: if \(y\) is in unit of meter (m), then St. Dev is in unit of m, variance in unit of \(\text{m}^2\)
Summary of key metrics
- Quantity
- The middle: mean, median, mode
- The spread: variance, standard deviation
- Visualising data is also important: BOXPLOT!
- Please check two types of SPECIAL VALUES before computing these metrics.
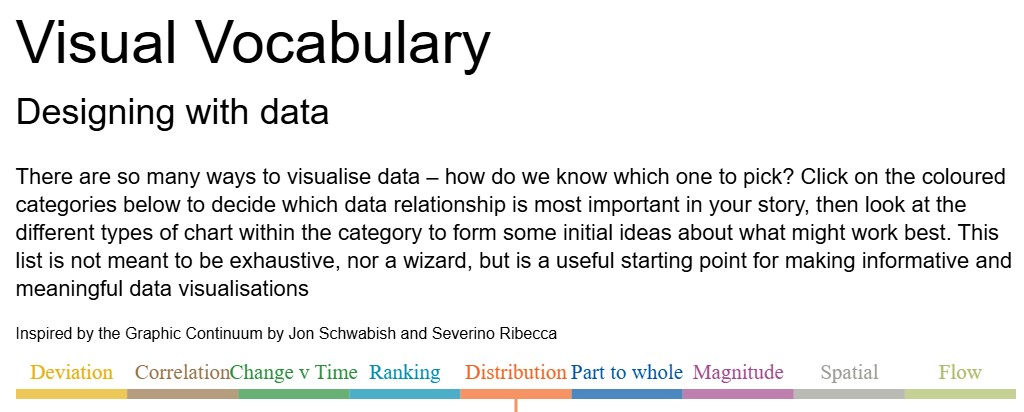
Visualising data

FT visual vocabulary
- https://ft-interactive.github.io/visual-vocabulary/
![]()
Boxplot for a dataset
- Showing distribution of a dataset
Boxplot for comparing multiple datasets
When boxplot fails?
- When there are lots of ‘outliers’ in the data
- What are ‘Outliers’?
Special values: null and outliers
Null values
- Representing the absence of data or an unknow value
- Different from zero or a blank space
- Null values should be excluded before computing mean or std
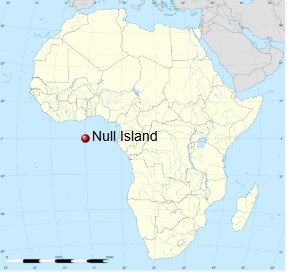
Null island in geography
- long=0, lat=0. Not even an island!
- It became famous because some software assigned “0,0” for long-lat when location is missing
- Many events were mapped to this one, including lots on Strava
- Source: wikipedia.org

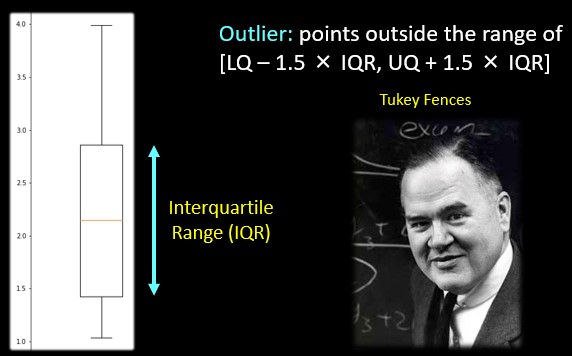
Outliers
- A data point that differs significantly from other observations
- There are three types of outliers
- Please explain the rationale for removing any identified outliers, including the criteria and methods used
Outliers
| Type | Source | Handling |
|---|---|---|
| Error Outliers | From mistakes in data collection/entry/measurement, e.g. a temperature sensor reading 500 °C | Should be corrected or removed |
| Irregular Pattern Outliers | ||
| Influential Outliers |
Outliers
| Type | Source | Handling |
|---|---|---|
| Error Outliers | ||
| Irregular Pattern Outliers | Genuinely occur, but do not follow general pattern or relationship in the dataset, e.g. sudden spikes in sales in Black Friday | They might indicate unusual events or anomalies worth investigating. If the purpose is to study overall pattern, they should be removed |
| Influential Outliers |
Outliers
| Type | Source | Handling |
|---|---|---|
| Error Outliers | ||
| Irregular Pattern Outliers | ||
| Influential Outliers | Appear extreme but are integral to the underlying pattern or model, e.g. NYC in US city population data | Should keep them, as removing them could distort the analysis or overlook important features of the data |
Detecting outlier: interquartile range (IQR)
Quiz: which type of outliers?
- error vs. irregular pattern vs. influential
- In building height data, 10-storey building with 1m height
- In gender ratios of countries data, Vatican City with gender ratio of 7:1
- In UK city GDP data, GDP of Greater London
Summary: describing a dataset
- Key metrics
- Null values and outliers (and handle them!)
- Visualising data
Overview
We’ve covered:
- Data types: levels of measurements; quantitative & qualitative
- Key metrics
- Null values and outliers
- Visualising data
Practical
Practical will focus on setting up Python environment and describing a dataset.
- Have questions prepared!
![]()
© CASA | ucl.ac.uk/bartlett/casa