Clustering analysis
Huanfa Chen - huanfa.chen@ucl.ac.uk
29th November 2025
CASA0007 Quantitative Methods
Last week
Lecture 9 - dimensionality reduction
Looked at:
- Understand the motivation of dimensionality reduction
- Understand the principle of Principal Component Analysis
- Can apply PCA to school datasets or other datasets
Objectives
- Understand the motivation and principle of clustering analysis.
- Understand K-Means and hierarchical clustering.
- Interpret the results of clustering analysis.
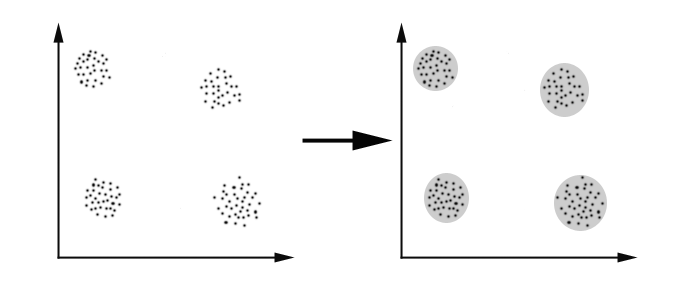
What is clustering
- Type of analysis that divides data points into groups based on some similarity criteria
- A cluster is a group of similar data points
Motivation of clustering
- Discover groups of similar data points
- Assist visualisation
Examples of clustering - Booth map
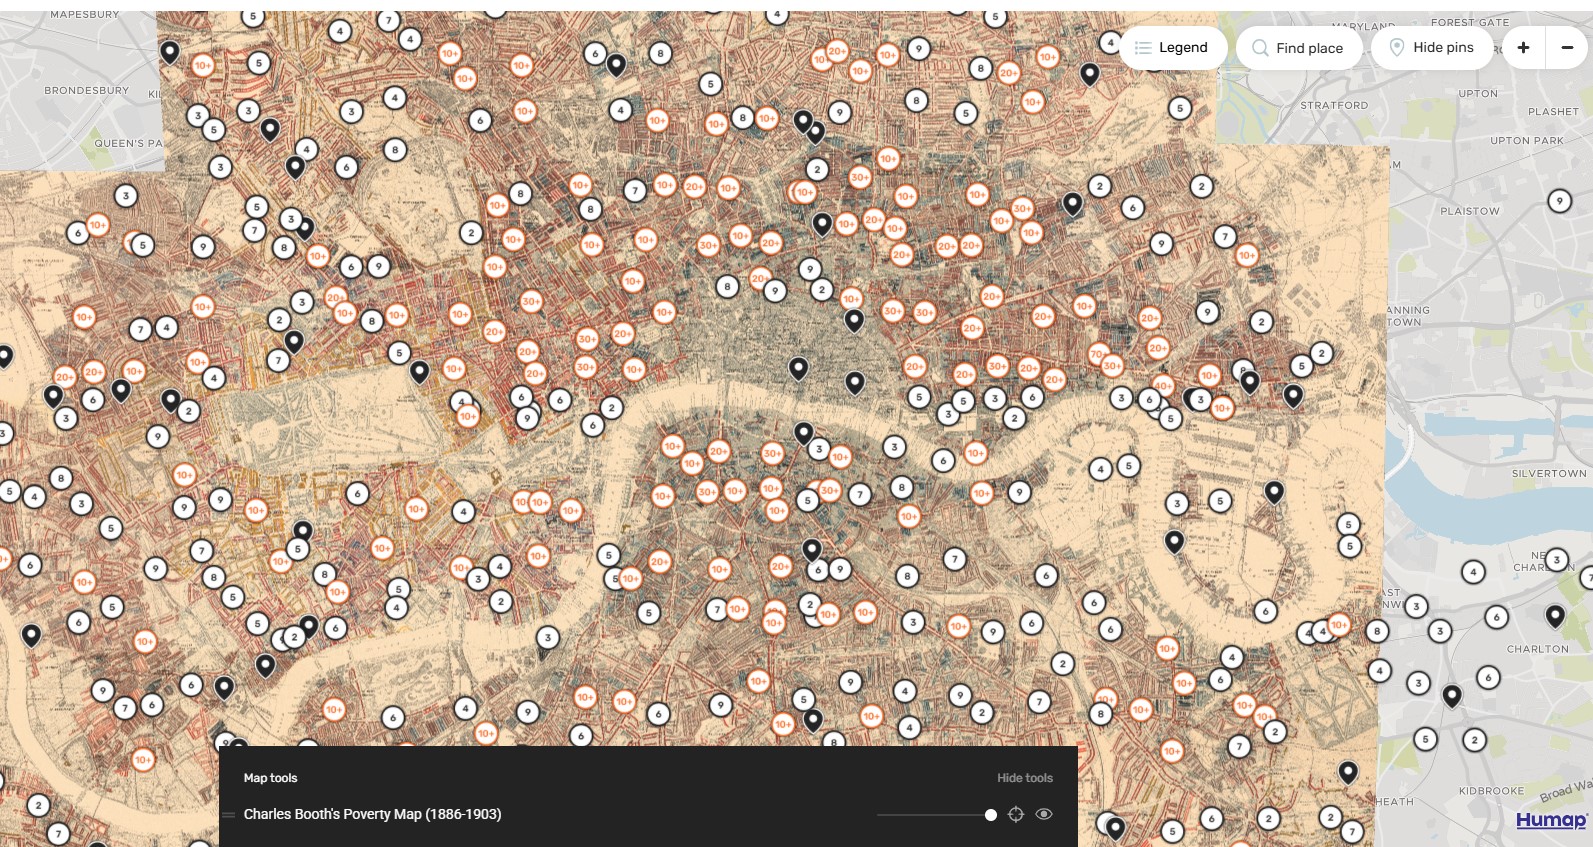
Image credit: https://booth.lse.ac.uk/map
Examples of clustering - London Output Area Classification
- Clustering OAs on 70+ socio-economic variables (non-spatial); 32000 OAs clustered into 8 groups
- Clusters have obvious spatial patterns but aren’t spatially connected
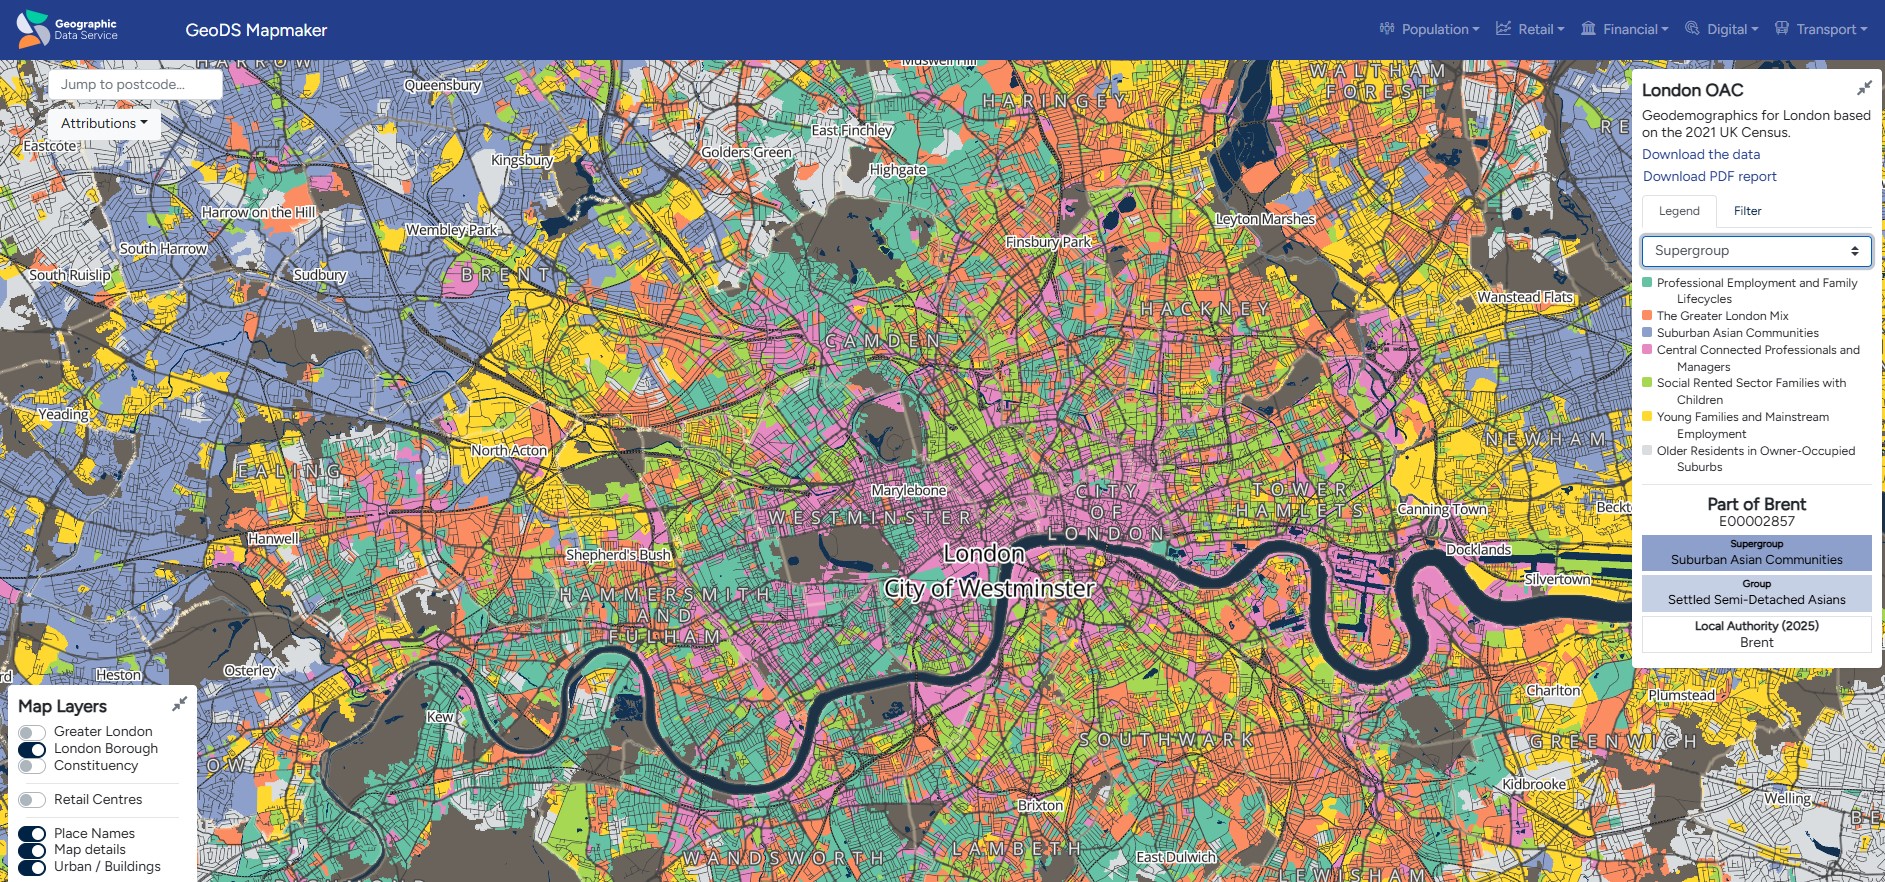
Image credit: https://mapmaker.geods.ac.uk/
Process of conducting clustering analysis
- Standardise variables
- Choose clustering algorithms (one or several)
- Select parameters of the clustering algorithm
- Interpret the results
- Finalise the clustering model
Steps
Iterative process (Expectation-Maximisation algorithm)
- Place k centroids randomly within space
- Assign data points to nearest centroid
- Recalculate centroids as the new mean of the cluster
- Continue until centroid assignments no longer change
Implications of centroid as mean of data points in a cluster
- K-Means is incapable of handling categorical variables, as we can’t calculate the mean of a categorical variable
- K-Means is sensitive to outliers, as an outlier significantly impacts the mean of a dataset
Problems with K-Means and solutions
- Sensitive to outliers (solution: use another clustering method, or remove outliers)
- Incapable of handling categorical variables (solution: k-modes or k-prototypes)
- Requires knowledge of the number of clusters (k), which we may not know in advance (solution: Elbow method to find k)
- Sensitive to centroid initialisation, which can lead to poor solutions (solution: try multiple random initialisation and pick up the best one; initialise centroid based on data distribution)
K-Means implementation in sklearn
- class sklearn.cluster.KMeans(n_clusters=8, *, init=‘k-means++’, n_init=‘auto’, max_iter=300, tol=0.0001, verbose=0, random_state=None, copy_x=True, algorithm=‘lloyd’)
- By default, this function uses init=‘kmeans++’, which selects initial cluster centroids using sampling based on an empirical probability distribution of the points’ contribution to the overall inertia
K-Means implementation in sklearn: output
- cluster_centers_: ndarray of shape (n_clusters, n_features). Coordinates of cluster centers.
- labels_: ndarray of shape (n_samples,). Labels of each point
- inertia_: float. Sum of squared distances of samples to their closest cluster center, weighted by the sample weights if provided.
- n_iter_: int. Number of iterations run.
- n_features_in_: int. Number of features seen during fit.
Selecting K
- Try different values of k.
- Plot the inertia (within-cluster sum of squares).
- Use the elbow method to pick a reasonable k where the decrease of inertia starts to flatten out.
Selecting K - example
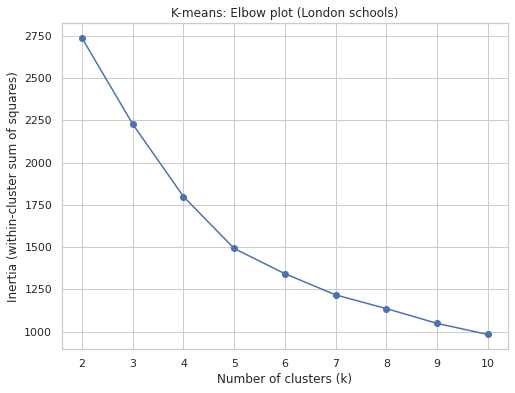
Result: k=5 is appropriate.
Definition
- Two ways of hierarchical clustering
- agglomerative: bottom-up; begin with one cluster per data point and gradually merge into larger clusters.
- divisive: top-down; begin with one big cluster and gradually split into smaller clusters
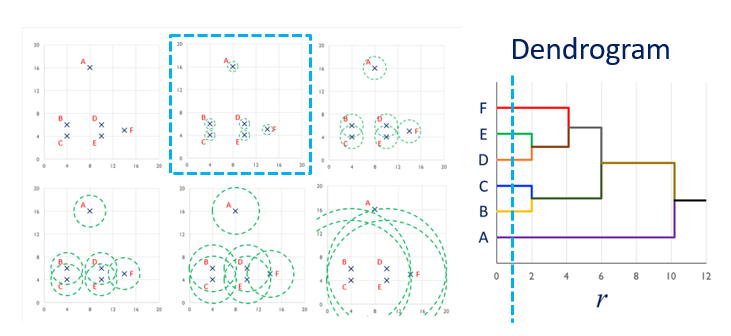
Process
- Start with every point in its own cluster
- Merge points according to a linkage criterion (or distance)
- Compute centroid of new clusters
- Expand linkage threshold and continue until all points in one cluster
Advantage of hierarchical clustering
- No prior knowledge of data required
- Users can choose the level in a hierarchy structure or use Elbow methosd (similar to K-Means)
Linkage criterion (distance between two clusters)
- ward: to minimizes the variance of the clusters being merged (default setting for sklearn AgglomerativeClustering)
- average: the average of the distances of each data points of the two clusters
- complete (or maximum): the maximum distances between all data points of the two clusters
- single: the minimum of the distances between all observations of the two sets
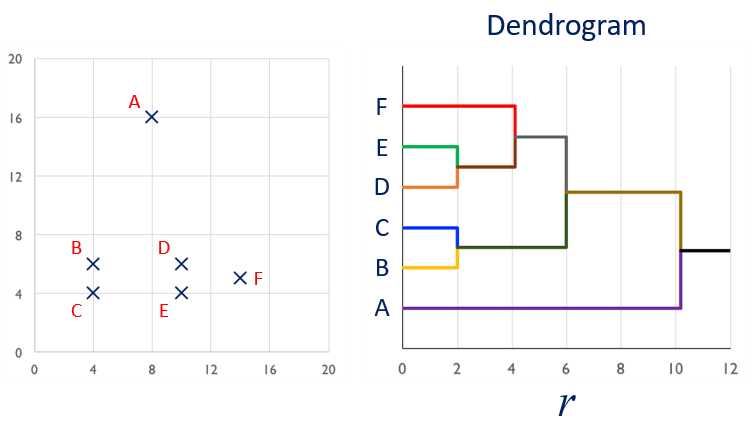
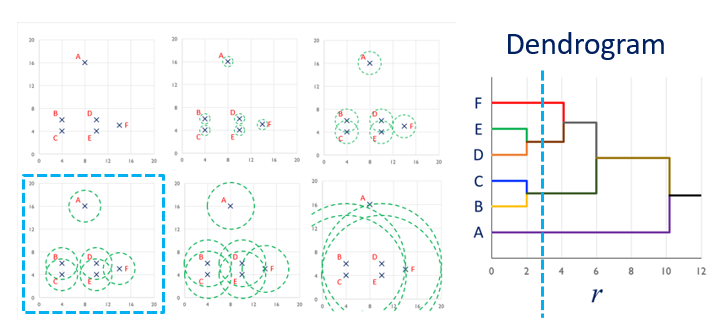
Example of hierarchical clustering
Example of hierarchical clustering (continued)
Example of hierarchical clustering (continued)
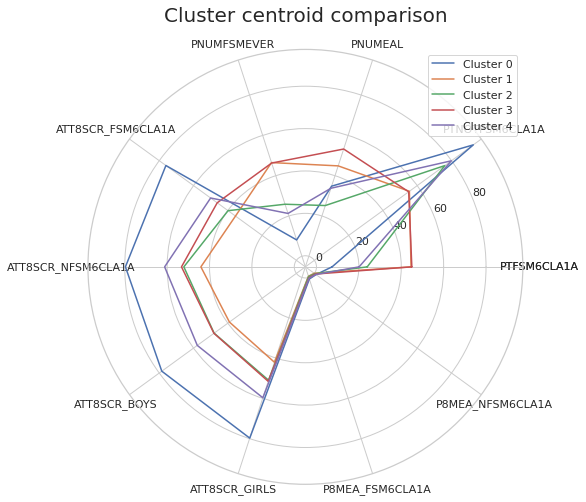
Interpreting clustering (clustering method-agnostic)
Cluster centroid as representative
Mapping
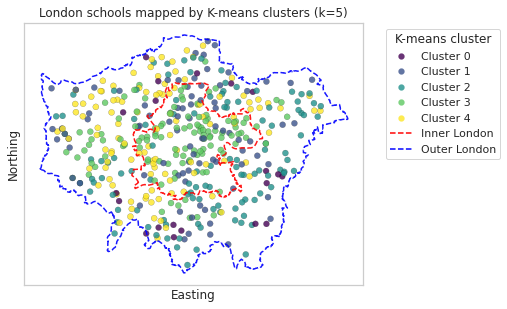
To check if schools belonging to a cluster are geographically clustered
Key takeaways
- Clustering analysis aims to identify groups within data points. It is a type of unsupervised learning.
- K-Means and hierarchical clustering are two popular clustering techniques.
- We can interpret clustering results via visualising the cluster centroids or mapping the clusters.
Practical
- The practical will focus on clustering analysis of the school data.
- Have you questions prepared!